How to demonstrate elearning ROI in the most relevant way
8 minute read
Are you measuring ROI of your elearning? Demonstrating value has always been an aspirational battle for L&D teams. It’s often talked about, but rarely done. But it doesn’t have to be hard, and finding the right measures for your organization will pay off (literally!). In this post, we share new ways to think about elearning ROI as part of a people-centered approach, and suggest six techniques you can use to prove the value of elearning to your organization. We’ve also outlined the key points you need to cover to help get your stakeholders onboard…

Why bother measuring elearning ROI?
Elearning, like all corporate training, is highly people-dependent and can be difficult to assess. A simple financial calculation just won’t cut it. Traditional learning management systems have struggled to provide evidence of effectiveness, so it’s easy to see why many L&D teams are resigned to not being able to prove their value.
But the great news is, the industry’s moved on. Limited LMS data is no longer the only option. Modern authoring tools, in-depth learner analytics and even sophisticated xAPI integrations mean that an ROI calculation that measures human engagement is achievable.
Traditional elearning ROI calculations
A traditional ROI calculation takes the benefit (or return) of your investment and divides it by the cost (or investment) you spent. So, for corporate elearning ROI, it’s the positive financial outcome your training program achieves divided by the amount you spent on the program. If you multiply this by 100, you’ll see your ROI as a percentage.

Sounds simple, right? And it can be, if your online training has a tangible goal that can be measured financially. This might not be immediately obvious, but if you ask yourself, “How will this training program make or save the business money?” you may well reach a financial goal.
For example:
- Elearning for sales staff on building rapport.
Better rapport > stronger relationships with the prospect > a better understanding of their needs > more sales.
The increase in sales figures would be the learning program benefits.
- Leadership elearning for junior staff to prepare them for potential promotion.
Improved leadership skills > more internal candidates for promotions > fewer external recruitment campaigns > recruitment costs saved.
The savings in recruitment costs would be the learning program benefits.
- Compliance training on handling customers’ data
Compliant employees > reduced risk of customer data issues > fewer (hopefully zero!) costly investigations or fines
The savings from not paying fines would be the learning program benefits.
Find an ROI calculation that’s right for your business
As satisfyingly simple as these financial calculations are, they aren’t always applicable or appropriate. They certainly aren’t the only factors that contribute to elearning ROI. After all, there’s value in the learning experience itself as well as the results it’s correlated with. Your ROI methodology can take other measurements into account, too – ones that represent what’s valuable to your organization.
Take a look at these alternative ROI measures we’ve seen our customers using. Which would prove value the most in your organization?
Speed to market
For online training providers, getting new products out before the competition is critical, so speed to market is a true measure of value.
Try measuring the amount of time it takes to get from new concept to product on the virtual shelf. (This training provider saw huge returns from their approach to elearning.)
Virality
Many large organizations are focused on learning culture – creating an environment where learning is voluntarily accessed and shared.
Try measuring the number of shares a module gets, or comments left by learners.
Time spent authoring
For any L&D team, particularly if it’s serving a large organization, being able to author a new elearning module quickly is hugely valuable.
Try measuring the amount of time it takes you to turn your storyboard into a live module.
Time spent learning
With all the focus on cost to produce, it’s easy to forget that the time it takes your audience to learn is time not spent “doing the job.”
Geographical spread
Global organizations are often trying to reach audience groups in multiple locations with a consistent learning experience.
Try measuring the number of countries you reach or languages you deliver your module in.
Learner feedback
The ultimate measure is, of course, your audience! How useful they find your elearning is crucial to any impact you hope to see from it.
Try measuring learner feedback through quick ratings at the end of each learning experience.
Where can you find data to measure these ROI alternatives?
A combination of quick surveys to gain qualitative data and quantitative learner engagement data from your authoring tool or LCMS should provide a wealth of information.
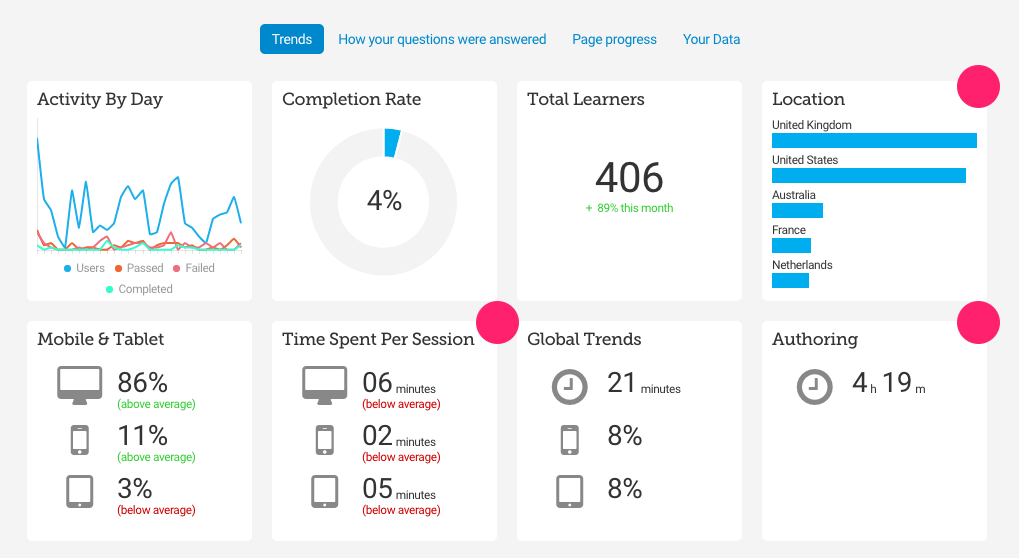
This example of Elucidat’s analytics dashboard shows how learner engagement data can play an important role in measuring elearning ROI:

Making smart investments
Some investments, such as a learning management system or elearning authoring tool, are long-term – but each project also has its own, specific short-term investment you can control. So an effective way to improve your ROI is to challenge the investment you make at the outset.
Questions to ask yourself:
- Does the project need to be a bespoke learning experience, or could you reuse an effective structure or design from a previous module to make it more cost-effective?
- Do you need to outsource the project to an elearning agency, or could you use (or purchase) an authoring platform to create a similar end result? You’re likely to make back the cost of an authoring tool from the savings of one or two outsourced bespoke projects.
- Do you need an instructional design expert to work on your module throughout, or could a subject matter expert script into a template that your instructional designer creates?
Some elearning projects definitely justify a significant investment. Using a set of criteria to identify the ones that do and challenge the others, you could see your investments decrease and your ROI improve as a result.
How to build a business case for elearning authoring tools
To build a strong business case for a new elearning authoring tool, you need to recognize that this isn’t all about you. Sure, an all-singing, all-dancing authoring tool will make your life easier – but that’s a side benefit for the business overall.
You need to think about key stakeholders:
- What are the big issues on their minds?
- How do these align with the goals of the overall business strategy for the next three years?
- Why should they care about your project?
- What is going to make them look good in front of their bosses?
You need to be able to cut through the noise and make clear the tangible benefits this investment will have for the organization.
Here are our recommendations for what to include in your business case for a new elearning authoring tool (or any investment, for that matter!).
1. The current state of play
How are you authoring currently, and what are the challenges with the existing approach? Think about things like efficiency and time spent, quality of projects, ability to scale up and adaptation to new demands. Also think about the changing needs of your learners and whether you can meet these with existing tools.
What are the risks of inaction?
2. Benefits of an alternative approach
Directly address the shortcomings of the existing tool or approach, and clearly outline how the proposed solution will overcome these. Highlight the unique aspects of your suggested tool and why it best meets your needs over alternatives.
Paint the picture of the “promised land”! Help your stakeholders imagine and visualize how much better the business will be with the new tool compared to the current situation.
Remember, the best salespeople will save you time by helping you identify the benefits and put together a business case – use them! You can contact the Elucidat sales team here, they’ll happily support you with this.
3. Be clear on costs
Communicate the costs of the new technology and make sure you consider things like training, if applicable. Compare this with existing costs and include other alternatives. If your recommended solution is more expensive, you need to be super clear on the additional benefit this brings to the organization. If you haven’t communicated the value clearly, then expect some questions from your stakeholders (or even a flat “No”).
4. Address the risks head on
All projects, initiatives and changes in technology have risks. Address them head on and be clear on how you would mitigate them. For example, will switching to a new authoring tool slow down production? How can you mitigate this? Does the provider offer professional services and training to ensure a fast and smooth transition? Will the new tool still meet your needs in three years’ time?
5. Share added benefits
You have outlined the benefits that address current business challenges, but are there other positive side effects? For example, will this tool help you attract the most forward-thinking instructional designers? Will you get regular product updates, rather than waiting for the yearly software release? What impact would higher quality learning have on staff retention?
6. Provide proof of concept
Your stakeholders have got to the end of your business case and think it all sounds pretty good, but they won’t want to take a risk on an unproven tool. This is a good time to SHOW them your idea, rather than just TELLING them about it. Consider creating a proof of concept in the actual tool so they can “touch and feel” the final output, rather than having to use their imagination. At the least, share elearning examples from others using your tool of choice. You can also provide links to case studies and reviews, and cite other organizations like yours that are seeing success. This will give stakeholders the confidence to make a positive decision.
Final thoughts
The key to building a solid business case that will win over your stakeholders is making a clear link between a better authoring tool and current (and future) business challenges. Make it as concrete and simple as possible.
While it is admittedly difficult to prove direct causation between elearning and a change in performance for individual elearning programs, it shouldn’t be difficult to demonstrate a correlation. And when human factors are involved to the extent that they are in learning, consistent correlations and additional ROI measures should be more than sufficient to prove the value your team contributes to your organization.
If building a business case still seems a little daunting, our consultants would be happy to help you with this (free of charge, of course!). Contact us today.


